Analytical metric reports
Analytical metric reports show you exact product usage and flow in your establishment at the end of each inventory period and the potential profit each product has on your bottom line. With the right data, better product decisions can be made.
Usage Data Report - Calculates and shows you complete usage numbers from the start of an inventory period to the end of an inventory period.

Usage Totals Report - Keeps a historical record of your past inventory period totals. This allows you to compare total usage numbers for each main category from one inventory period to the next.

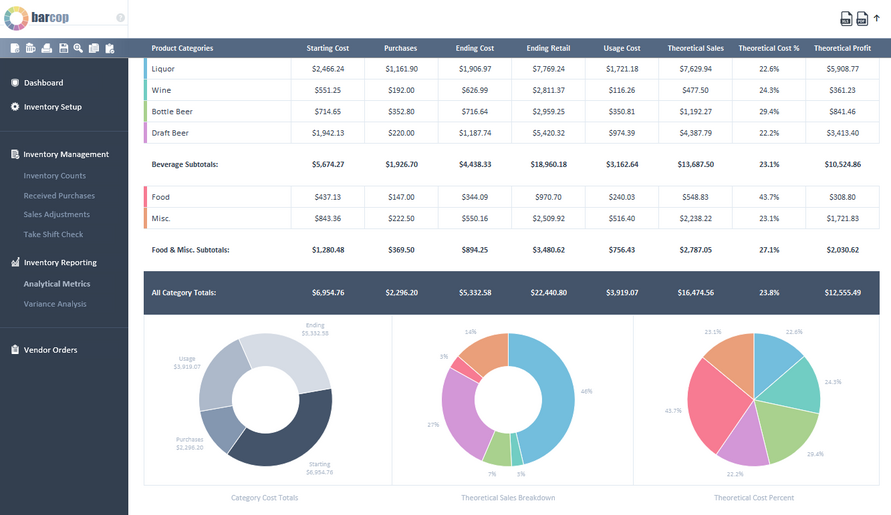
Stock Values Report - Breaks down your starting, purchases, usage, and ending inventory costs and then calculates the retail sales value for each one.

Most Used Report - Keeps track of your top ten product performers in each category. Catch trending products to adjust your sales strategies and stay ahead of the competition.

Least Used Report - Find out what products are taking up shelf space and not contributing to overall profit growth. Cut dead stock out of your inventory to improve cash flow.

Usage History Report - Bar Cop keeps historical data on each product's total usage that helps you easily compare product usage from one inventory period to the next as product's popularity and trends change.

Stock Check Report - Learn if you're holding on to too much product by checking your top on-hand products at the end of an inventory period.

Things to know:
1) Usage data is tracked from the start of an inventory period to the end of the period. Each inventory file should be saved as a different name to keep complete data of each inventory period for your records.
2) In each category, the analytical metric reports can easily be exported to Excel or PDF format by clicking on the Excel and PDF icons located in the top right corner.
3) If you see a #value error in a product row, that product is missing or incorrectly entered data (ie. like a coma entered instead of a decimal place) needed to calculate that report number. The missing or incorrect data will usually be found in the product setup or inventory counts section.